Blockchain security isn't optional.
Protect your smart contracts and DeFi protocols with Three Sigma, a trusted security partner in blockchain audits, smart contract vulnerability assessments, and Web3 security.
Get a Quote Today
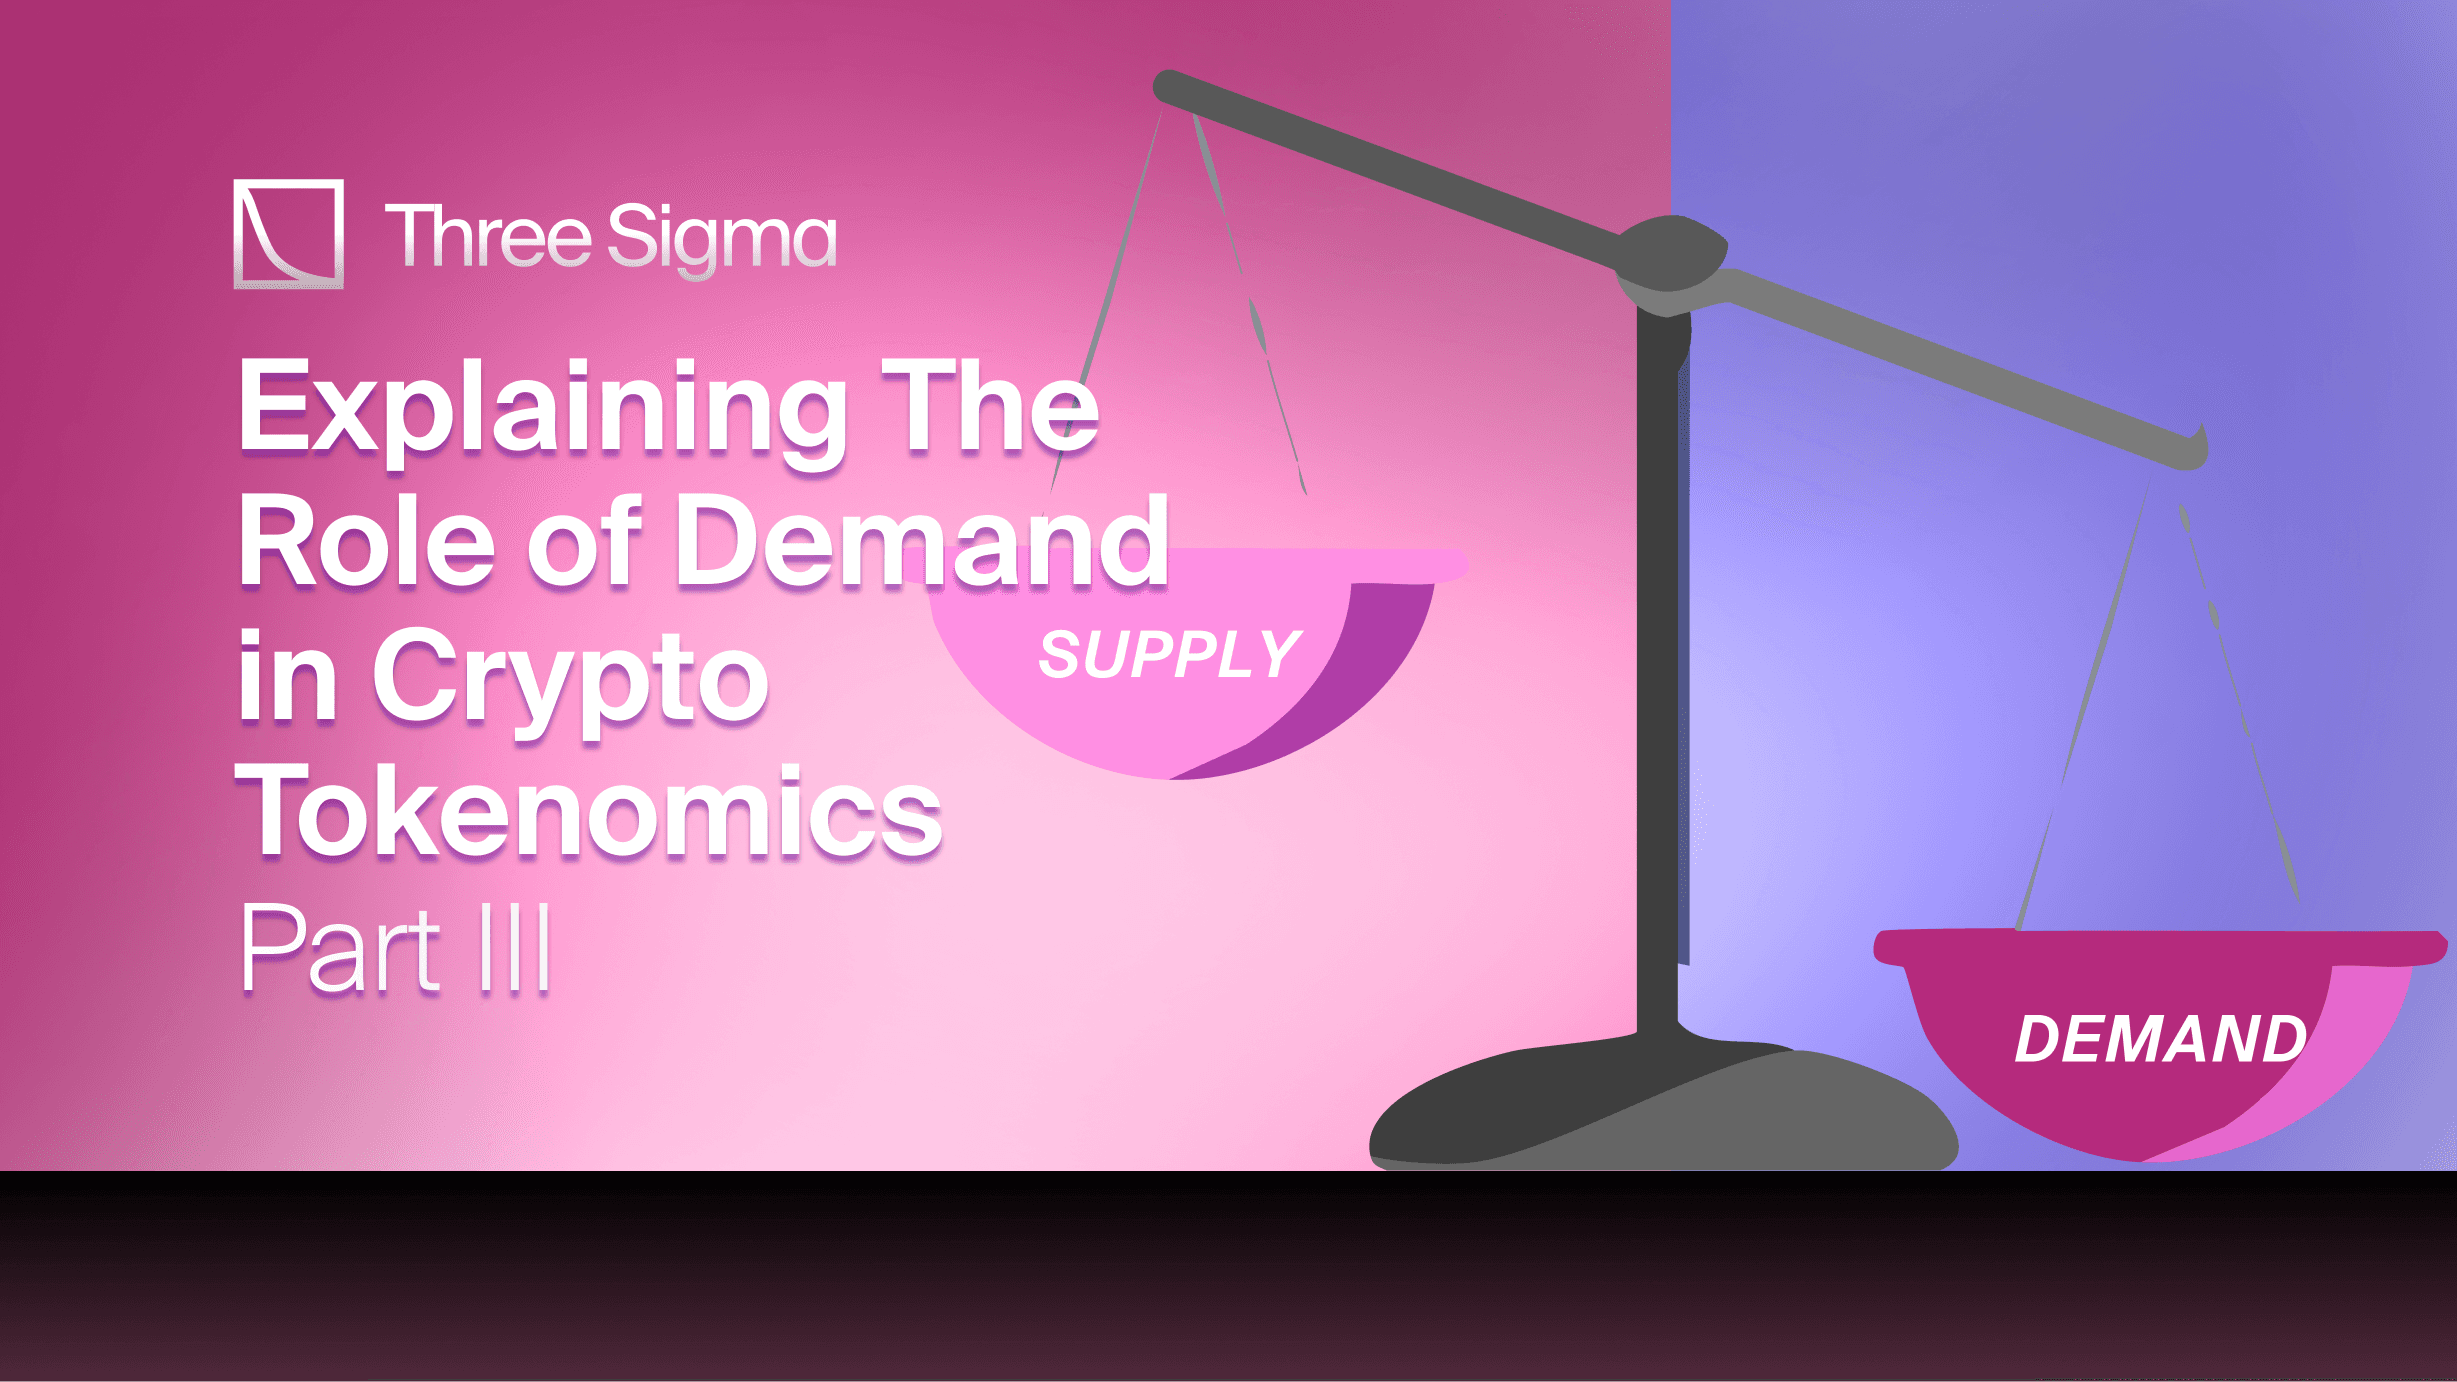
This is the second part of a two-part blog post about how supply and demand affect token design. The first part explained how to match the project's goals with your token and manage the supply side, while this second part provides a deeper understanding of the mechanisms that drive demand and how to balance both sides of the scale. Read the first part here.
Demand
Token demand is driven by the benefits the token provides and the expectation that these benefits will grow. It is certainly a less objective topic than token supply and the key lies in determining what mechanisms most drive demand for a token in its particular environment. For users to demand a token, they must find that it comes with some utility. Below, we explore some mechanisms that you can use to give a token economic utility.
Store of value, unit of account, and medium of exchange
Tokens can generally serve as a store of value, unit of account, and medium of exchange. The ability to do these basic functions is a fundamental characteristic that contributes to its overall value. A store of value refers to the ability of the token to maintain its purchasing power over time. This means that the token should be able to hold its value and not be subject to significant volatility, making it a reliable asset to hold.
A unit of account refers to the ability of the token to be used as a measure of value for goods and services. This means that the token can be used to price and quantify the value of different assets within the ecosystem. This enables easy comparison and tracking of value within the ecosystem and is a key component in facilitating trade and commerce.
A medium of exchange refers to the ability of the token to be used as a means to facilitate transactions. This means that the token can be used as a form of payment for goods and services within the ecosystem. This is important for the token to be widely accepted and used within the ecosystem, which helps create a functional economy.
Overall, the ability of a token to serve as a store of value, unit of account, and medium of exchange is a key part of any ecosystem and adds value that grows as the ecosystem grows. As more people use the token and more goods and services are priced in it, the token becomes more valuable and useful, creating a positive feedback loop that encourages continued growth and development.
Revenue sharing
One of the most direct ways you can give a token utility is to use it as a vehicle for revenue sharing. You can distribute part of the project’s revenue back to token holders, who can have a right to, for example, a portion of fees generated by the platform. In an AMM, for example, this can refer to a small percentage of each trade that traders pay the platform for allowing their trade. Such revenues can be distributed on-chain periodically, akin to on-chain dividends, or as they come. It is important to consider that the form of this revenue distribution should be able to retain its value to influence demand, as the distribution through an illiquid token, for example, might not have the same impact. They can also be distributed through a buyback-and-burn mechanism in which the proceeds are used to remove tokens from circulating supply to increase the perceived value of remaining tokens. In this case revenue sharing would be directly influencing the supply and not the demand of a token.
Some tokens with revenue-sharing functions are thought by legal experts to be classified as securities via regulators, which brings problems for functioning in US markets. In the US, tokens that are sold as investments and provide a return on investment, such as through dividends or buybacks, are considered securities. Therefore, they are subject to securities laws and regulations. The main problem with this is that in order to legally sell securities, the issuer must either register the offering with the Securities and Exchange Commission (SEC) or qualify for an exemption. This can be a costly and time-consuming process, and many projects may not be able to meet the requirements. Additionally, even if a project is able to register or qualify for an exemption, they still must comply with ongoing reporting requirements and other regulations. This can be a significant burden for projects and may discourage them from using the revenue sharing token model.
Governance rights
Governance rights can help you bring a significant amount of utility to a token. Governance rights refer to the ability for token holders to participate in the decision-making process of the protocol or platform that the token is associated with. This can include things like voting on proposed changes to the protocol, participating in community decision-making, or even having the ability to propose new initiatives.
The utility of governance rights can be seen in a few key ways. First, governance rights give token holders a sense of ownership and control over the protocol or platform. This can create a sense of community and engagement that encourages long-term participation and investment.
Second, governance rights can be used to align the interests of token holders with the interests of the protocol or platform. When token holders are able to participate in decision-making, they are more likely to act in ways that benefit the protocol or platform, and therefore benefit the value of their own tokens.
Third, governance rights can be used to create a more efficient and responsive ecosystem. When token holders are able to participate in decision-making, they can provide valuable feedback and input that can help improve the protocol or platform. This can help create a more effective and sustainable ecosystem over time.
Overall, you can use governance rights to bring a significant amount of utility to a token by creating a sense of ownership, alignment of interests and creating a more responsive and efficient ecosystem. The perceived utility will vary depending the size and scope of addressable decisions, the amount of protocol resources being managed, and the ability to influence the outcome. The value of governance is therefore hard to quantify, and it may be drastically more appreciated in some DeFi categories than others, e.g. when there is a direct link to monetary gains by directing liquidity rewards in decentralized exchanges. It should also be mentioned that governance powers may not always be uniformly distributed, which can also affect the perceived value of governance. For example, the case where holders of tokens that are still vesting are granted governance rights can be problematic, as their time horizon is not the same as the actual active participants and this might misalign their interests.
Reserves
Tokens can be backed by and redeemable for other assets, such as fiat currency, other cryptocurrencies or even real-world assets, providing them inherent value. Stablecoins are an example of this, but not the only one. Some tokens are backed by assets in reserve even if they are not pegged to the value of these assets. Olympus, for example, introduced the token OHM. There was $1 worth of assets in reserve for every OHM, and if the price of OHM ever reached this value, the reserve should be used to buyback tokens. In this case, however, the assets were not redeemable, until the mechanism of inverse bonds was introduced by the end of 2022. Inverse bonds allowed Olympus to create a means to bring OHM out of circulation, which increases the backing per OHM on every inverse bond that is executed. OHM is essentially given back to the treasury in return for treasury assets, but only when token price is below liquid backing.
By holding reserves of the underlying assets, you can provide stability for the token's value and reduce volatility, which can increase demand for the token by making it more attractive as a store of value. If a project can create a perception that the token is a store of value, this can increase the perceived value of the token, and therefore increase the demand for the token, as it becomes more attractive as a means of preserving wealth. By holding redeemable reserves of the underlying assets, you can ensure that the token can be redeemed for the underlying assets at any time, which can increase demand for the token as it provides an easy way to convert the token into other assets, making it more attractive for investors and traders. The perception that the token is backed by tangible assets can also increase the perceived value of the token and increase trust in the project, and therefore increase the demand for the token. This should however be part of the considered mechanisms for adding value to the token and not in isolation. It's worth noting that the size, management and transparency of the reserves are important factors that can affect the demand as well.
Benefits, boosts, discounts and airdrops
You might reward token holders for just holding or staking their tokens. This might come in the form of airdrops of more tokens or of a token of a related project, boosted liquidity mining rewards or discounted platform fees. You can also introduce gatekeeping mechanisms, when only holders of that token can have certain benefits such as access to certain services or other assets, e.g. the possibility to mint an NFT. These mechanisms can contribute to token awareness, which can also increase demand for the token. It is however important to remember that the design of the benefits, boosts, discounts, and airdrop programs and their management can have a great impact.
Penalties
You can choose to retain demand by imposing penalties for negative behaviors, for example through staking withdrawal penalties or taxes on selling, encouraging token holders to not part with their tokens. When you use the staking mechanism by imposing penalties for withdrawing tokens before the end of the staking period, you can create an incentive for token holders to hold on to their tokens for the long term. On the other hand this mechanism has to be well-built, so that it does not create selling pressure if a large quantity of tokens reaches the end of the staking period at the same time. A token tax is a mechanism, where token holders are charged a percentage of their tokens when they sell them on the open market. This can also discourage token holders from selling their tokens.
Marketing and community building
Tokens can evoke certain emotional and behavioral contexts, such as a sense of community and the belief that others will pay more for the token in the future. Active marketing campaigns on twitter, community engagement on discord and other forms of community building can be consciously explored to boost these effects and impact demand. The value of these approaches is hard to measure, but it is important to consider as it can have a significant impact on the demand for a token.
Some emotional and behavioral situations, such as fear of missing out can create a feeling of urgency that can increase the demand for the token. Tokens can also evoke a sense of community among token holders, as they are invested in the same project and share a common goal. This in turn creates a sense of belonging which can make token holders more likely to hold onto their tokens. As the project and token gains more adoption and recognition, holders believe that others will pay more for the token in the future, which can create a feeling of anticipation that can increase the demand for the token.
It is also worth noting that this perception can change quickly with market conditions and that a sense of community may not be sustained during a bear market.
Remarks on the demand side
Given the factors that affect demand discussed above, it is natural that demand increases over time along with an increasing awareness and usage of the protocol, which is expected to increase token utility. It is also important to keep in mind that although some aspects of token demand are fundamental and straightforward, a lot of it is also speculation. These speculative components can be very volatile and difficult to address directly. Being able to appropriately measure the pressure that is caused by supply and balance it with any of these mechanisms by influencing demand is key to maintaining a sustainable token. In turn, choosing between which mechanisms are appropriate in each project, ecosystem, and global context is also very important.
Balancing it all
For us, tokenomics design is about integrating game theory with the economic forces that determine supply and demand. Game theory should help you design the key mechanisms that allow the token to further the project’s goals. It should be used in conjunction with the supply and demand model to design better tokenomics by analyzing the strategic interactions between different stakeholders and how they may influence the overall token economy and the ecossystem. For example, in the context of token issuance and distribution, game theory can be used to analyze the effects of different token issuance models, such as a fixed supply or inflationary supply, on the overall token economy. You could also employ it to analyze the effects of different token distribution mechanisms, such as mining, staking, or airdrops, on the distribution of token ownership and the incentives of different stakeholders. By understanding how different stakeholders may react to different issuance and distribution mechanisms, game theory helps you identify models that align incentives and promote sustainable tokenomics. In the context of token demand, game theory should be used to analyze the effects of different governance mechanisms on the decision-making power of different stakeholders and the overall direction of the project. This can help you identify governance models that align the incentives of different stakeholders and promote sustainable demand for the token.
Fine-tuning the equilibrium
This article has examined the primary dynamics that drive supply and demand in the context of blockchain projects as well as game theory's application to ensure that the interests of all stakeholders are aligned. Even after considering all of these essential components of token design, the rewards, fees, and other factors still need to be fine-tuned or even optimized. The precise values you should choose are frequently determined later in a project through governance proposals, but it is essential for these to be selected in a cautious and deliberate way. For example, when considering token emissions, it is crucial to employ forecasting techniques before issuing tokens in order to have a clear grasp of how the token value is anticipated to fluctuate as well as the repercussions of this price movement for the project. We elaborate on this effect through the next paragraph to illustrate the kinds of considerations involved in the fine-tuning process of tokenomics.
When you increase the supply of a token, how much do you expect the token value to decrease, all else equal? It is unlikely that the token value drops just as much as supply increases in a 1:1 relation. Indeed, a recent study observed that an increase in supply might still grow a token’s market cap. Market cap is the total supply times the price, so this would mean that an increase in supply on average is not fully cancelled out by the corresponding price drop. This is known in the stock market as the stock split premium. When stocks get split, the market cap often increases, as buyers’ entry barriers are reduced, causing increased demand and a growing holder base that promote liquidity and, hence, a higher price. In crypto, this effect is stronger, as when projects use new token emissions for airdrops or as rewards to attract new users, the holder base is often directly increased without going through a secondary market. As an example, this implies that it could make sense for a project to emit 10% more tokens and give some of them to existing holders so that they the price effect does not apply to them, while giving the rest to potential new users and enjoy the best of both worlds. Exactly what part should be given to existing holders so that they don’t experience a loss of value is an important calculation. One study concluded that, on average, on blockchain projects, when supply increases by 10%, the price drops by 5%. If one was to follow this, then half of the emitted tokens should be given to current holders. Naturally this is on average, and it is relevant to consider other factors such as the general market context, the market cap and what type of project it is.
The context is also important to consider, as “all else equal” does not truly exist. It is agreed upon that supply increases have less impact on prices in bull markets, as demand is higher and can help balance this impact. One article shows that a 10% supply increase leads to almost 7% price drop on average in a bear market, while only a 3% price drop in bull market. It is interesting that this negative relation is most common for established tokens with a large market cap. For micro-cap tokens, i.e. tokens with a market cap below $1.5 million, an increase in supply may actually lead to price growth, as increasing the holder base increases liquidity and secondary market demand. This effect also depends on the direction of the supply change. A decrease in supply seems to be more relevant than an increase in supply. This might be closely related to the fact that supply decreases due to token burn or buybacks are usually highly marketed, while token issuance can largely go unnoticed.
Curve as an example
Curve is an automated market maker that launched in January 2020 and offers low-slippage trading on Ethereum and other supported chains. It incentivizes pool liquidity by paying out a yield to LPs from trading fees and CRV emissions. In August 2020, Curve launched the Curve DAO and its native CRV token, which allows holders to participate in governance by locking their CRV into non-transferable, vote-escrowed CRV (veCRV). Voting power is determined by the amount of CRV locked and the duration of the lock, ranging from one week to four years. By directing CRV emissions to the pools of their choice through a weekly gauge vote, veCRV holders can incentivize liquidity using CRV rather than their native token. Additionally, locking CRV allows holders to earn 50% of all trading fees on Curve and boosted LP rewards, with the boost increasing proportionally with the time-lock, up to 2.5x for a four-year lock. This vote-locking mechanism creates a flywheel where the more CRV one has, the more they can accumulate in the future. It also removes CRV from the circulating supply, supports its price, and allows those who control veCRV to direct liquidity. Curve's CRV token exemplifies the nuance and lack of absolutes in tokenomics design, with a current total supply of only ~52% of its maximum supply. However, the ability for veCRV holders to direct future CRV emissions through governance provides utility and creates strong demand for CRV, offsetting the incremental liquid supply created from future emissions. Overall, Curve seems to represent a well-calibrated balance of supply and demand to support its objective of deep liquidity within a sustainable economic model.
Sources & References
- Rosic, A. (2020). What is Cryptocurrency Game Theory: A Basic introduction. Retrieved fromhttps://blockgeeks.com/guides/cryptocurrency-game-theory/
- Fernando, J. (2023). Law of Supply and Demand in Economics: How It Works. Retrieved from https://www.investopedia.com/terms/l/law-of-supply-demand.asp
- Supply and demand. Retrieved from https://www.britannica.com/topic/supply-and-demand
- Revenue sharing token. Retrieved from https://smithandcrown.com/glossary/revenue-sharing-token/
- OlympusDAO. (2022). Introducing Inverse Bonds. Retrieved from https://medium.com/@olympusdao/introducing-inverse-bonds-9199cc7bf089
- Tascha. (2022). The Curious Effect of Token Supply on Price. Retrieved from https://taschalabs.com/the-curious-effect-of-token-supply-on-price/

Economic Modeler
Carolina is a data analyst with a Master’s degree in analysis and engineering of big data and a background in mathematics applied to economics and management. She has experience working on optimization problems, leveraging statistics to produce simulations and extract valuable insights. She joined Three Sigma with a continued passion for finding knowledge in data and an interest in improving the blockchain industry by contributing to its sustainable development. Outside of work, Carolina enjoys traveling and immersing herself in foreign environments.

Economic Modeler
Joana has a Master’s degree in finance and a background in mathematics applied to economics and management. She has spent the past three years working at a private equity company, becoming familiar with traditional finance concepts and honing her analytical skills. The opportunity to blend her mathematical expertise with her finance background is what initially sparked her interest in the blockchain field. Joana joined Three Sigma with a strong eagerness to make a valuable contribution to the world of decentralized finance, which she excitedly believes has great potential. In her free time, Joana enjoys traveling and engaging in sports.


